Admissions and Test Scores
Acceptance Rate
100.00%
SAT Average
Not available
ACT Range
Not available
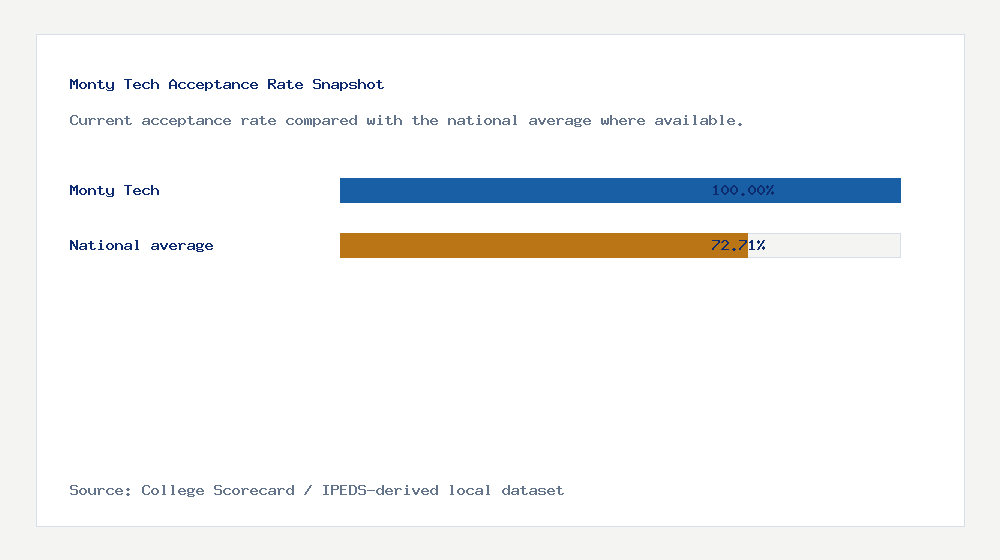
Monty Tech Acceptance Rate Trend
The current College Scorecard value in this local dataset is 100.00%. This means approximately 1,000 applicants were admitted per 1,000 who applied, based on the local dataset enrollment of 33 undergraduates. Historical year-by-year acceptance rate data will appear here after multi-year College Scorecard releases are imported.
Current dataset
100.00%
Current trend marker with historical import pending
Tuition, Net Price and Aid
| Metric | School value | Context | Source |
|---|---|---|---|
| Accreditation | Council on Occupational Education | Institutional accreditor where reported | Verify |
| In-state tuition | Not available | National avg: $20,567 | Verify |
| Out-of-state tuition | Not available | National avg: $20,567 | Verify |
| Attendance cost | Not available | Use with aid and net price | Verify |
| Average net price | $35,312 | State avg: $23,961. National avg: $17,506 | Verify |
| Pell grant rate | 43.90% | Federal need-based grant indicator | Verify |
| Federal loan rate | 87.80% | Share using federal loans | Verify |
What You Pay
Based on available data, the average student at Monty Tech pays approximately $35,312 per year after grants and aid. This is above the Massachusetts average of $23,961 and above the national average of $17,506.
How Affordable Is Monty Tech?
Average net price after grants and scholarships, compared to Massachusetts and national averages.
Monty Tech net price
$35,312
Massachusetts average
$23,961
National average
$17,506
Monty Tech Tuition and Net Price Trend
The current imported dataset shows tuition at Not available and average net price at $35,312. A multi-year trend chart will appear here after historical College Scorecard release tables are imported.
Current tuition
Not available
Current net price
$35,312
Current-year comparison is shown now; historical bars will replace this fallback once multi-year College Scorecard releases are imported.
Student Outcomes
Completion Rate (150% Time)
Not available
Completion data is not reported for Monty Tech in the federal College Scorecard dataset.
10-Year Earnings
Not available
10-year earnings are not reported for this school in the federal dataset.
Undergraduates
33
10-Year Median Earnings - Monty Tech vs Peers
Median earnings 10 years after enrollment. Source: College Scorecard federal dataset.

Who Attends Monty Tech?
Undergraduates
33
Completion rate
Not available
National comparison unavailable; national avg: 52.02%
Pell recipients
43.90%
Above national average; national avg: 42.32%
Federal loan rate
87.80%
Above national average; national avg: 40.83%
Completion vs national average
Pell grant recipients
Federal loan usage
Financial Aid
About 43.90% of Monty Tech students receive federal Pell grants, indicating the share of students receiving this need-based aid in the local dataset. 87.80% take federal loans, which helps families understand borrowing patterns alongside net price.
Estimate Your Net Price at Monty Tech
Select a family income bracket to see the average net price students in that range paid. Data comes from College Scorecard income-bracket averages when available.
Estimated net price for :
This estimate is based on College Scorecard averages for students in this income range who received federal aid. Actual amounts vary. Use Monty Tech's official Net Price Calculator for a personalized figure.
Accreditation
Monty Tech lists Council on Occupational Education as its accreditor in the local dataset. Institutional accreditation is an important trust signal and can affect federal financial aid eligibility. Accreditation means an external agency has reviewed academic quality and institutional standards, which helps families verify whether federal aid pathways such as Pell grants and federal loans may apply.
Campus and Location
Monty Tech is listed at 1050 Westminster St, Fitchburg, MA 01420. Accreditor: Council on Occupational Education.
Compare Schools
Compare Monty Tech with nationally comparable peer institutions across acceptance rate, tuition, net price and 10-year earnings. Click any school name to open its full profile.
| School | Accept. rate | Out-of-state tuition | Avg net price | 10-yr earnings |
|---|---|---|---|---|
| Monty Tech | 100.00% | Not available | $35,312 | Not available |
| Massachusetts Institute of Technology | 4.74% | $60,156 | $19,813 | $143,372 |
| Franklin W Olin College of Engineering | 21.66% | $64,458 | $20,575 | $129,455 |
| MCPHS University | 85.21% | $38,850 | $35,084 | $125,557 |
| Babson College | 19.74% | $56,032 | $38,876 | $123,938 |
Similar Schools in Fitchburg
This local cluster focuses on nearby Fitchburg schools, not national peers. Use it to compare local net price, acceptance rate and enrollment options around Fitchburg.
Frequently Asked Questions
What is Monty Tech's acceptance rate?
Monty Tech's acceptance rate in the local dataset is 100.00%.
What is Monty Tech's average net price?
Monty Tech's average net price in the local dataset is $35,312.
Is Monty Tech accredited?
Monty Tech's accreditor in the local dataset is Council on Occupational Education.
How many students attend Monty Tech?
The local dataset lists 33 undergraduate students at Monty Tech.
What percentage of Monty Tech students receive Pell grants?
The Pell grant rate for Monty Tech in the local dataset is 43.90%.
What is the federal loan rate at Monty Tech?
The federal loan rate for Monty Tech in the local dataset is 87.80%.
Where should I verify Monty Tech data?
Use this page for comparison, then verify admissions, tuition, net price and student outcomes directly with Monty Tech or the latest official federal education data.